

- 23 Oct 2023, 17:27
#1837
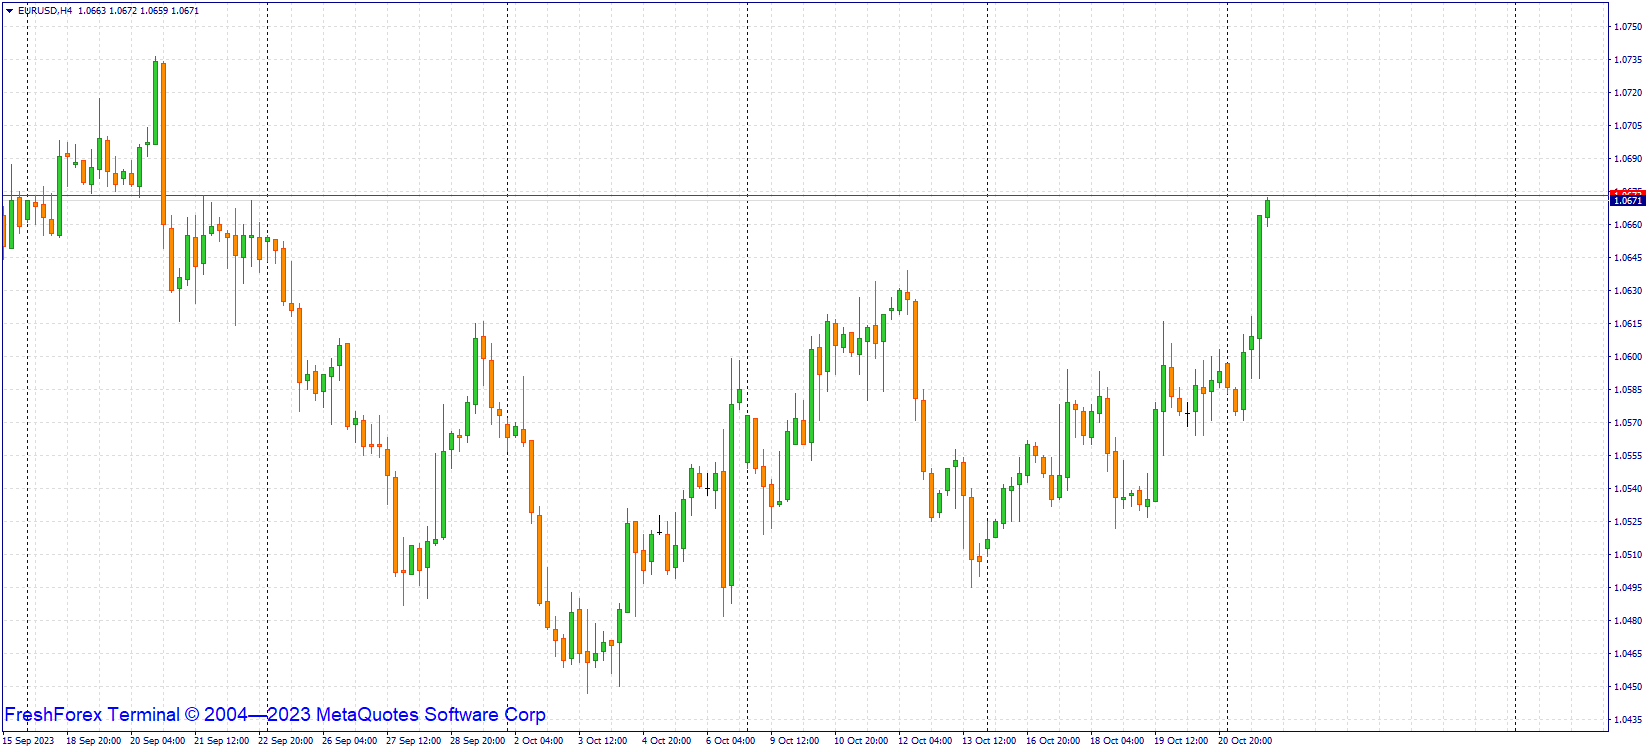
EUR/USD holds above the ascending trend line coming from early October, and the Relative Strength Index (RSI) indicator on the 4-hour chart stays above 60, reflecting the bullish bias.
1.0600, where the 200-period Simple Moving Average (SMA) is located, aligns as a key pivot point. If EUR/USD confirms that level as support, 1.0640 (Fibonacci 38.2% retracement) and 1.0700 (Fibonacci 50% retracement) could be set as the next bullish targets.
On the downside, strong support is located at 1.0570–1.0560 (50-period SMA, 100-period SMA, Fibonacci 23.6% retracement) ahead of 1.0540 (ascending trend line, static level) and 1.0500 (psychological level, static level).
 - By Silentman