

- 23 Oct 2023, 18:05
#1841
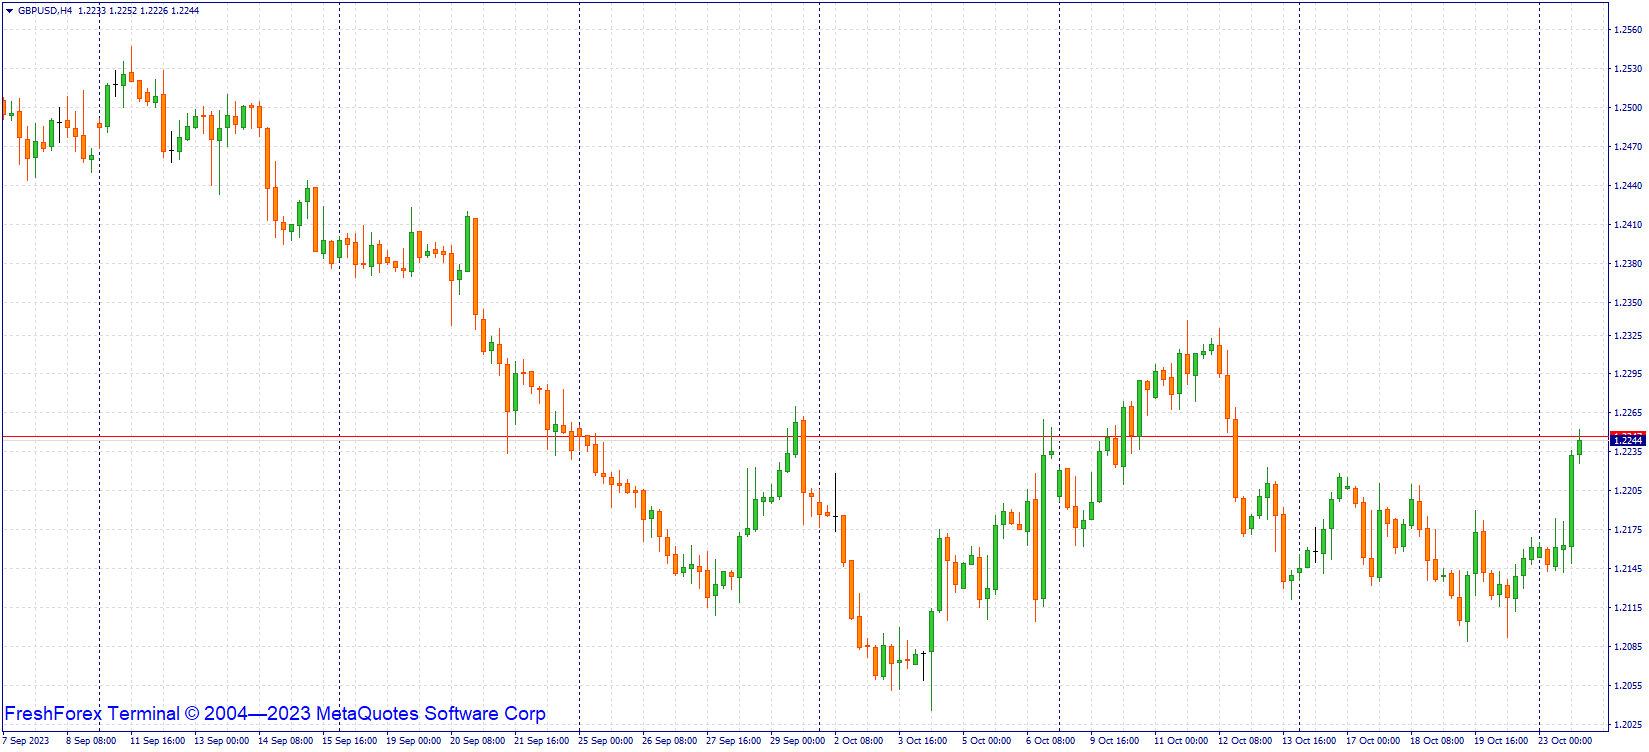
GBP/USD started to edge lower after rising to the 1.2185–1.2200 area, where the 100-period Simple Moving Average (SMA) on the 4-hour chart and the Fibonacci 23.6% retracement of the latest uptrend align. Meanwhile, the Relative Strength Index (RSI) indicator retreated to 50, pointing to a lack of recovery momentum.
Immediate support for GBP/USD is located at 1.2150 (20-period SMA) ahead of 1.2100 (static level, psychological level). A 4-hour close below the latter could open the door for an extended slide toward 1.2050 (the end point of the downtrend).
In the event that GBP/USD manages to stabilize above 1.2185–1.2200, buyers could show interest. In this scenario, 1.2260 (static level, Fibonacci 38.2% retracement) could be set as the next recovery target.
 - By Silentman